
ProductsLoopBrain
Layer 2 network assurance
Stop a loop before it stops the network.
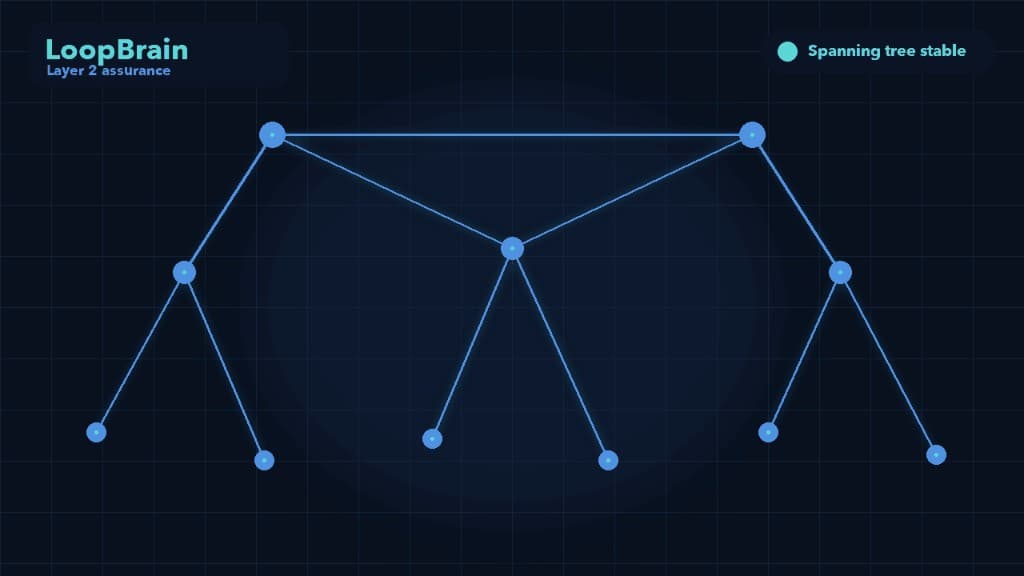
LoopBrain puts the spanning tree on one screen. It watches for the mispatch, the wrong root, and the forwarding loop, then shows the operator which link to clear and what that change will touch. Beyond spanning tree, it is the one-stop solution for Layer 2 intelligence in the network, so operators gain visibility and peace of mind.
Layer 2 still fails in the dark.
A default bridge priority, a PortFast trunk, or one patch cable between two access ports can fill a building with traffic in seconds. A poll every thirty seconds arrives after the storm. A vendor controller sees only its own switches. A packet capture cannot sit on every closet.
The outage is usually short to start and long to explain. Engineers spend the hour drawing the tree by hand from CLI output while users are already offline.
One picture of the tree. A warning before the storm.
Spanning tree is where the work starts. LoopBrain is also the one-stop solution for Layer 2 intelligence, giving network operators visibility across the campus and peace of mind when the closet changes. It is a telemetry-driven assurance platform for campus, data center edge, and branch networks. Collectors read switch state, normalize it across vendors, and hand a live Layer 2 graph to the detection engine. Operators get the topology, the alert, the evidence, and a remediation path that stays under their control.
How it works
1. Collect
Switches report state over streaming telemetry, with fallback through NETCONF, SNMP, and CLI. Each vendor plugin maps that output into the same model: STP instances, interfaces, and MAC tables.
2. Judge
Rules watch the conditions that create loops: an unexpected root, a port role that will not settle, a blocking port that starts forwarding, two paths live at once. Correlation waits for more than one signal before it raises a high-severity alert.
3. Act
The alert names the devices, the VLAN, and the likely blast radius. Remediation is tiered. The operator sees the proposed change, the checklist, and the rollback before anything is sent to the switch.
What operators get
Live topology
Core, distribution, and access on one graph. Root, port role, and forwarding state update as the tree changes, so the next person on the bridge does not start from a blank diagram.
Loop risk, not only loop aftermath
The useful alert is the one that fires while the network is still up: wrong root, guard features missing, a second forwarding path. When a loop is already present, the same view shows where it closed.
Forensics
Every topology change is kept in order. After the incident, the timeline answers what moved, on which switch, and which VLAN it affected.
Remediation with a human gate
Suggested action, predicted impact, operator confirmation, and a way back. The platform does not treat a shutdown as a casual API call.
A plugin per vendor
Cisco IOS-XE is the reference collector. Other vendors are plugins on the same contract, so spanning-tree state from a mixed closet lands in one graph instead of several management tools.
Built for an operations team
Role-based access, an audit log, and notifications to Slack, Teams, PagerDuty, email, or a webhook. Viewers can see the tree. Operators can act. Admins can see who did.
Who it is for
Network teams that still depend on spanning tree and feel it when a closet changes. Typical rooms: a bank trading floor, a hospital wing, a university campus, a managed service desk that inherited three vendors and one diagram from 2019.
The entry point is the same in each case. Show the live tree. Show the risk before the next maintenance window. Shorten the time from “something is wrong” to “this link, this VLAN.”
See the tree before the ticket.
Bring a closet, a VLAN, and a change window. We will show the topology, the alert, and the exact step an operator would take.